Budgets, actuals, debtors, and forecasting. One trusted view of your school's financial position, refreshed nightly from your school's finance system.
FINANCIAL VISIBILITY
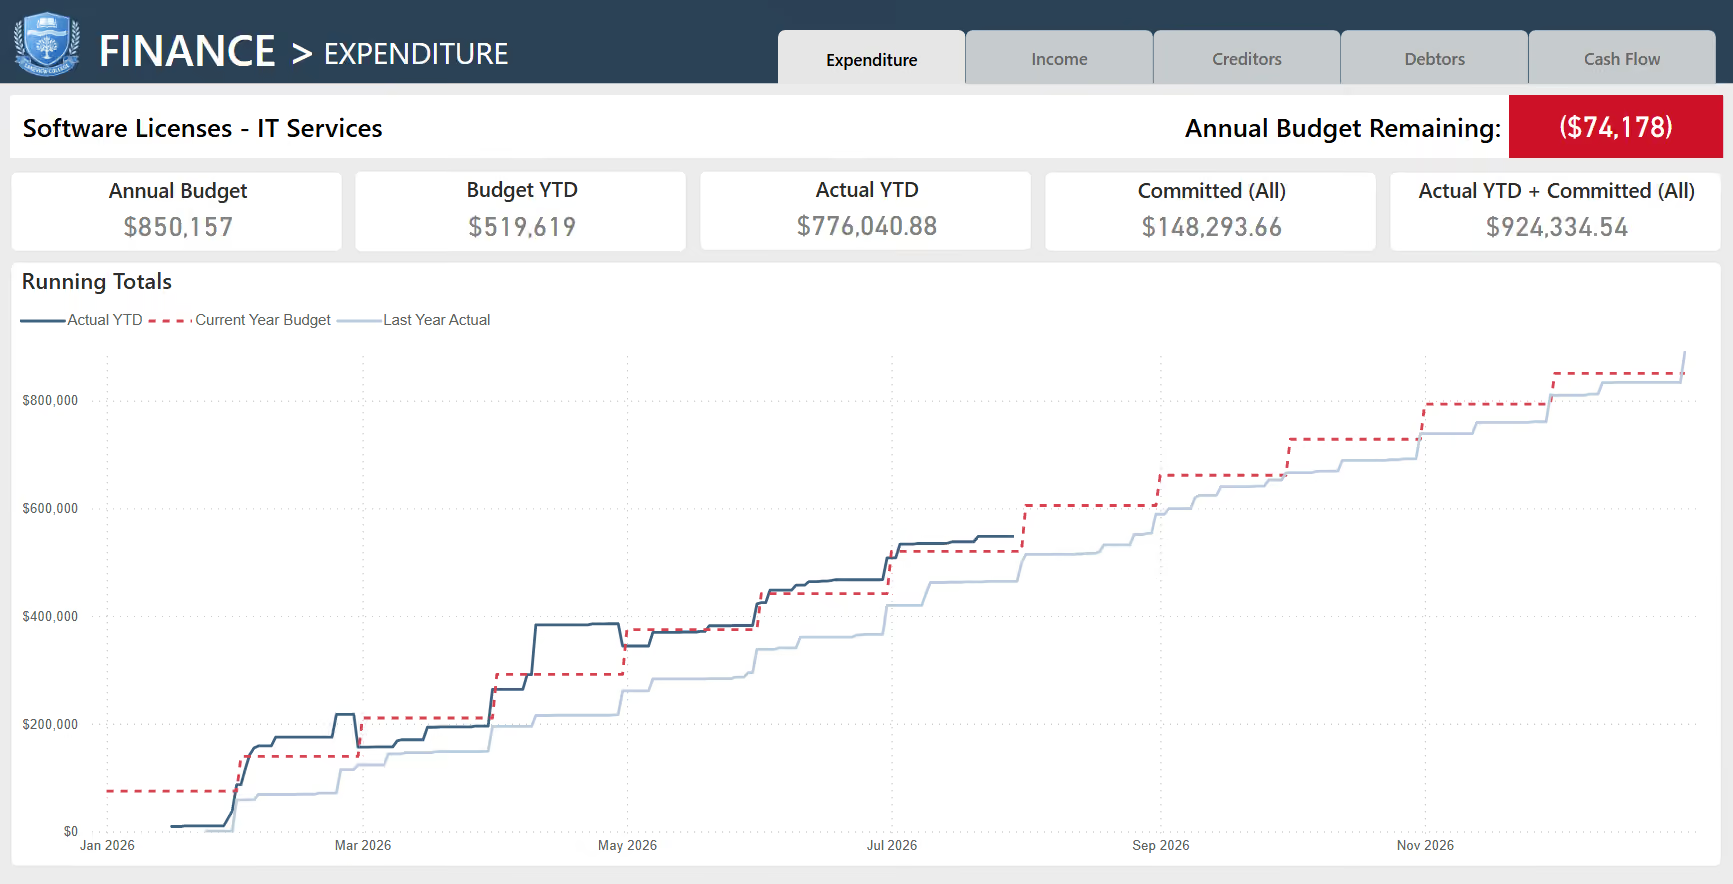
Connect your finance system to Power BI for real-time visibility into budgets vs actuals, debtors, creditors, and department-level performance. No more waiting for month-end spreadsheets.
Budget vs Actual
98.2%
Debtor Days
24
Fee Collection
96.4%
Refresh
Nightly
Fee collections by month
Illustrative example. Built from your billing cycle, fee schedule and enrolment data.
FEES & ENROLMENTS
Track fee billing, collections, and concessions against enrolment movements. Model the revenue impact of enrolment changes before they happen.
BOARD-READY REPORTING
Finance dashboards secured with Power BI row-level security. Your business managers see everything, budget holders see their departments, and the board sees a clean summary.
Budget vs actual by department
Illustrative example. Your dashboards are built to your chart of accounts and reporting structure.